Cost of living is on the rise – and that means tough spending choices for people and their families. With many households likely to have less money for non-essentials, where do we think we will spend more, or less, over the next 12 months? Will we cut down across the board as things get tighter – or, after two pandemic-hit years, will we shuffle our spending to prioritise the things we’ve missed out on the most?
To find out, we commissioned a nationally representative survey of 2,000 people in the UK – to ask about their spending over the next 12 months. And we’ve discovered that, after two years of COVID-19, it’s “experiences”, rather than other luxuries such as home furnishings, gadgets and jewellery which attract more of our interest; and despite talk of “levelling up”, some regions are noticeably more likely to tighten their belts. At the same time, we plan to spend more on insurance – perhaps because in these uncertain times we increasingly realise the importance of having a safety net which allows us to enjoy the best that life has to offer.
27%
plan to spend more on holidays over the next 12 months
2022: a year to spend money on experiences
Spending on Holidays/travel
27% plan to spend more on holidays / travel
12% plan to spend less on holidays / travel
Spending on Eating out
31% plan to spend more on eating out
19% plan to spend less on eating out
Spending on Insurance
20% plan to spend more on insurance
9% plan to spend less on insurance
Spending on Experiences with family
18% plan to spend more on experiences with family
7% plan to spend less on experiences with family
Spending on Experiences with friends
13% plan to spend more on experiences with friends
7% plan to spend less on experiences with friends
Spending on Electronics and gadgets
14% plan to spend more on electronics and gadgets
18% plan to spend less on electronics and gadgets
Spending on Furniture
10% plan to spend more on furniture
15% plan to spend less on furniture
Spending on Music subscription services
5% plan to spend more on music subscription services
10% plan to spend less on music subscription services
Spending on Exercise equipment
6% plan to spend more on music exercise equipment
12% plan to spend less on music subscription services
Spending on Jewellery
9% plan to spend more on jewellery
17% plan to spend less on jewellery
In the past two years, COVID-19 has kept us inside far more than we’d like. So, perhaps unsurprisingly, our figures show a trend towards spending more on experiences that involve getting out and about – such as holidays, eating out, and spending time with family and friends. The flipside? People are likely to spend less on things to keep busy at home, such as exercise equipment, music and streaming services, or gadgets.
Women are driving the ‘experiences’ trend
While it’s not unsurprising that we want to spend more on experiences with our family and friends, our figures show that it’s women who are driving this trend. Men, it seems, are more likely than women to prioritise spending money on cars and electronic gadgets. The chart below shows some of the biggest differences between women and men.
21% of women plan on spending more on experiences with family
14% of men plan on spending more on experiences with family
14% of women plan on spending more on experiences with friends
11% of men plan on spending more on experiences with friends
Gen Z want to get out of the house
Lockdowns have been hard for younger people keen to just get on with their lives – so it’s notable that the 18–24 age group are keener to spend on nightlife and socialising than any other group. This age group is also far more likely than others to spend on clothes and takeaway coffees, and the second most likely to want to spend more on eating out.
While they’re less likely to want a takeaway coffee, over-65s still want to spend more on eating out and holidays, and are the second most likely age group to expect to spend more on their car.

People want to spend more on:

Nightlife and socialising

Eating out

Takeaway coffee

Cars/vehicles

Clothes
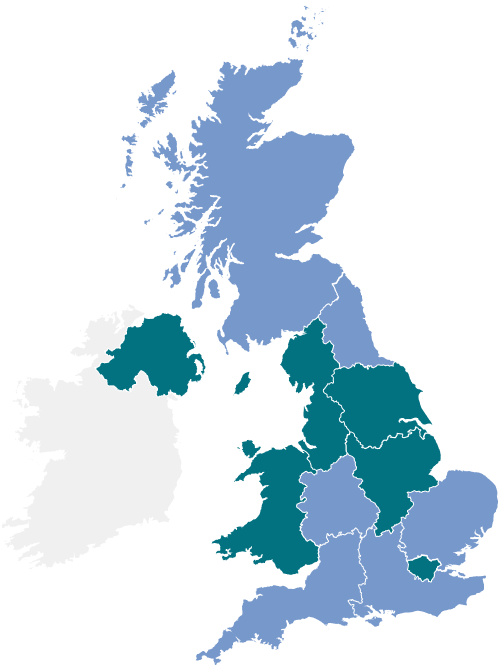
Some regions are noticeably tightening belts
In some regions, people seem to be more noticeably planning to tighten their belts. This is particularly true in East Anglia, Yorkshire/Humber and the South West, where the number of people planning to spend “less” exceeds the number of people planning to spend “more” in at least 13 out of 21 spending categories.
Spending on Clothes
London
34% plan to spend more on clothes in London
17% plan to spend less on clothes in London
East Midlands
14% plan to spend more on clothes in the East Midlands
31% plan to spend less on clothes in the East Midlands
Spending on Cars/vehicles
West Midlands
27% plan to spend more on cars/vehicles in the West Midlands
9% plan to spend less on cars/vehicles in the West Midlands
East Anglia
8% plan to spend more on cars/vehicles in East Anglia
15% plan to spend less on cars/vehicles in East Anglia
Spending on Takeaway coffee
Northern Ireland
24% plan to spend more on takeaway coffee in Northern Ireland
12% plan to spend less on takeaway coffee in Northern Ireland
East Anglia
10% plan to spend more on takeaway coffee in East Anglia
20% plan to spend less on takeaway coffee in East Anglia
Spending on Electronics and gadgets
Northern Ireland
24% plan to spend more on electronics and gadgets in Northern Ireland
17% plan to spend less on electronics and gadgets in Northern Ireland
Yorkshire and the Humber
8% plan to spend more on electronics and gadgets in Yorkshire and the Humber
22% plan to spend less on electronics and gadgets in Yorkshire and the Humber
People spend £960 a year on impulse purchases
Of course, what we plan to spend money on doesn’t always reflect our eventual purchases, because we also spend on impulse. Our survey shows that more than half of respondents (56%) say they consider each purchase carefully, while 14% think they are impulse buyers.
Yet on average, respondents say they spend £18.53 on impulse buys every week – adding up to more than £960 each year. Some 21% of us spend £31 a week or more on impulse purchases, which is more than £1,600 over a year.
On average, respondents estimate they spend £578.62 on car, home, contents, life, phone and travel insurance each year; so impulse purchases alone exceed this.
£18.53
spent on impulse buys every week
21%
spend £31 a week on impulse buys
Impulse purchases typically add up to
↳£1,600
over a year

Lockdown has changed the perception of our things at home
Lockdowns have changed the way we look at the contents of our homes, our survey shows. As many as 43% agree they are “more fond” of their things after being locked down for the best part of two years – with only 14% disagreeing. A quarter (25%) say they have “many” items at home which they consider irreplaceable and therefore priceless.
Despite this, of those with home and/or contents insurance, 15% say they have little or no understanding of what the insurance does and doesn’t cover.
If you had to estimate, how much do you think the entire contents of your house costs?
Of course, we generally acquire more stuff as we get older, as the following table shows.
By age:
18-24year olds estimate the value of their contents at
£21,744
25-34year olds estimate the value of their contents at
£23,073
35-44year olds estimate the value of their contents at
£27,255
45-54year olds estimate the value of their contents at
£32,029
55-64year olds estimate the value of their contents at
£36,166
65+estimate the value of their contents at
£31,611
Value of contents by property size:

The average value of contents for an Average property is
£29,452

The average value of contents for a One bed flat is
£15,713

The average value of contents for a Two bed flat is
£22,099

The average value of contents for a Three bed flat is
£24,255

The average value of contents for a One bed house is
£24,097

The average value of contents for a Two bed house is
£27,866

The average value of contents for a Three bed house is
£32,418

The average value of contents for a Four bed house is
£41,361
People plan to spend more on insurance
Despite the cost-of-living crisis, insurance remains important to us whether we’re driving, travelling or at home. And when it comes to insurance of all kinds, more of us think we’ll actually spend more than less. As many as 20% think they’ll spend more insurance, compared to 9% who think they’ll spend less.
The young and old are the age groups most likely to spend more on insurance. Interestingly, it’s also the youngest and oldest groups who are most likely to profess a “complete” understanding of what their home and contents insurance covers – indicating that it’s these age groups who value insurance the most.
Who thinks they’re likely to spend more on insurance?

Overall 20% of people
think they’ll spend more on insurance
Gen Z have more insurance for their things
While Gen Z are likely to spend more on insurance, this is reflected in the fact younger people already have more of their personal belongings insured – compared to older age groups.
18 to 24s are over four times more likely to insure their jewellery than 55-64-year-olds and twice as likely to insure their watch.

Who has insurance for their Jewellery?

Who has insurance for their Watches?
Summary by Claudio Gienal, Chief Executive Officer for AXA UK and Ireland
“The cost-of-living crisis has understandably made many people nervous about what lies ahead. Amid this challenging climate, our report reveals some fascinating insight into how the nation is planning to spend its money in the coming months.”
Two years on from the first COVID-19 lockdown, the majority of us are prioritising experiences over purchases as we make up for lost time and enjoy getting back to the good stuff with our loved-ones post-pandemic.
But our report does highlight significant generational and geographical differences - showing how everyone is being squeezed in different ways. While Gen X say they'll buy less insurance over the next 12 months, Gen Z are set to spend more, which suggests they don’t see insurance as a luxury but as a vital safety net which allows them to get on with their life and do the things they love.
Despite the average UK home estimated to house £29,452 worth of contents, we know that many people undervalue their contents and run the risk of being left unprotected.
The report highlights that while those who understand insurance value it in these uncertain times, there is still more to be done to educate those who don’t to help them recognise the importance of getting the right protection.

Calculate the value of your contents for home insurance
Do you know the value of the contents in your home? To help you estimate, we’ve pulled together some top tips and created a Contents Insurance Calculator to identify how much your possessions are worth.